
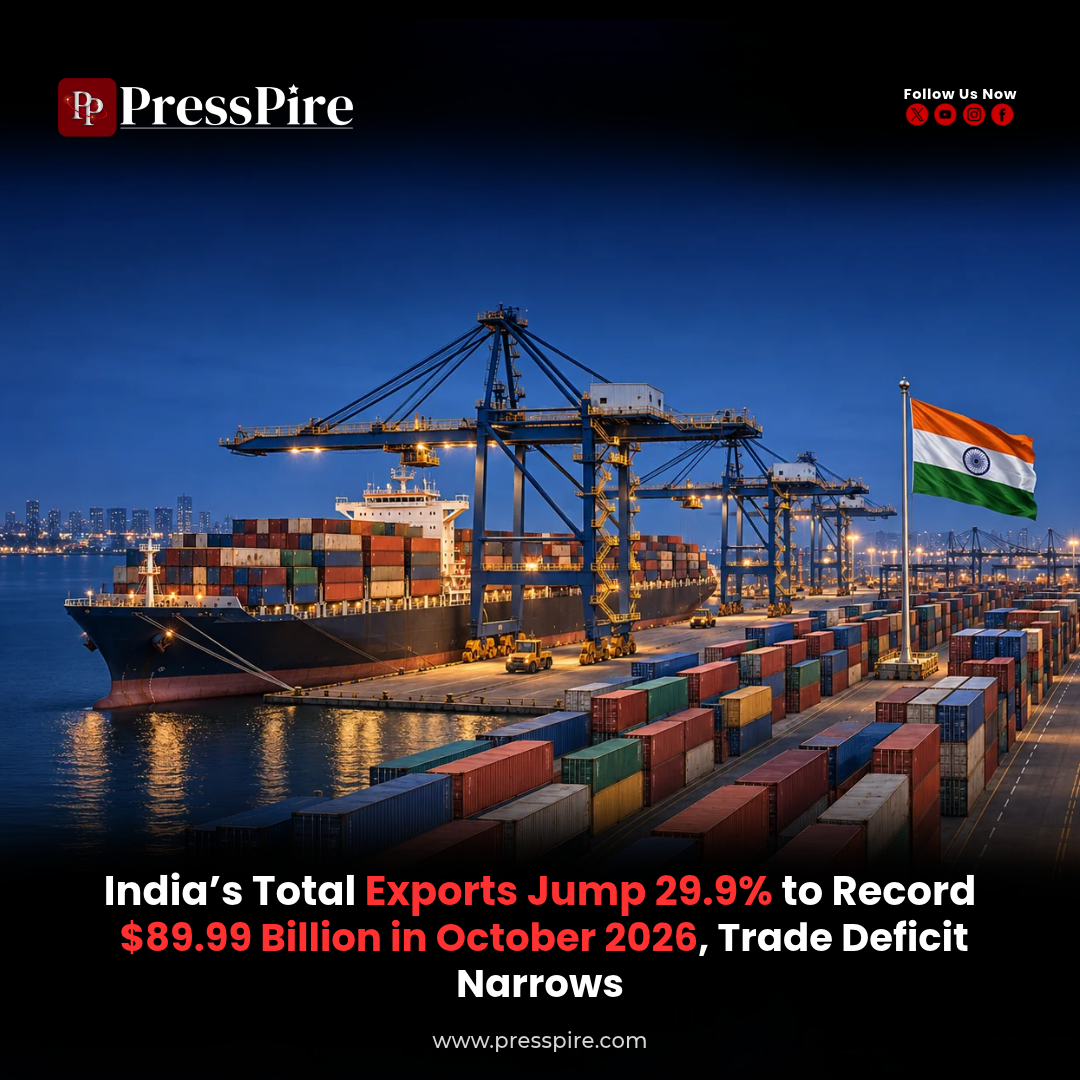
India’s Total Exports Up 29.9% to Record $89.99 Billion as Trade Deficit Narrows
October’s combined export earnings reached a new high, while the overall trade deficit fell to $20.09 billion compared with a year earlier.
India’s total exports rose 29.9% year-on-year to an estimated record $89.99 billion in October 2026, according to trade figures released by the Ministry of Commerce and Industry on November 13, 2026.
The total includes both merchandise and services exports. Goods shipments reached $49.47 billion, while services exports were estimated at $40.51 billion.
Total imports increased 16.58% to $110.07 billion. With export earnings rising faster, the combined goods and services trade deficit narrowed to $20.09 billion, compared with $25.15 billion in October 2025.
The figures show a strong month for export earnings, supported by manufacturing shipments and a services surplus. They also reveal continued pressure from the import bill, particularly when October is compared with September.
India’s Total Exports: October 2026 Figures
The main figures show how goods and services contributed to the monthly trade performance.
| Trade indicator | October 2025 | October 2026 |
|---|---|---|
| Merchandise exports | $34.11 billion | $49.47 billion |
| Estimated services exports | $35.17 billion | $40.51 billion |
| Combined exports | $69.27 billion | $89.99 billion |
| Combined imports | $94.42 billion | $110.07 billion |
| Overall trade deficit | $25.15 billion | $20.09 billion |
Figures are reported as published by the ministry. Rounded components may not add precisely to the published totals.
The services figures for October are estimates. At the time of the release, the latest services data available from the Reserve Bank of India covered September 2026.
Merchandise India’s total exports Rise 45.06%
Goods exports increased 45.06% from a year earlier, reaching a monthly record of $49.47 billion.
Merchandise shipments supplied the larger share of India’s total exports in October, with growth across several major product categories.
Engineering goods generated the highest export value among the five categories highlighted below. Petroleum products recorded the fastest percentage growth within that group.
| Export category | October 2026 value | Year-on-year growth |
|---|---|---|
| Engineering goods | $12.74 billion | 36.01% |
| Petroleum products | $8.89 billion | 140.21% |
| Electronic goods | $6.64 billion | 62.70% |
| Gems and jewellery | $3.21 billion | 40.06% |
| Organic and inorganic chemicals | $2.89 billion | 36.20% |
Growth also extended beyond petroleum and jewellery. Exports excluding those categories reached $37.38 billion, compared with $28.11 billion a year earlier—an increase of approximately 33%.
That broader measure helps assess whether the improvement extends across the export basket, especially when commodity-related categories experience large changes in value.
Services Provide a $19.79 Billion Trade Surplus
Estimated services exports increased to $40.51 billion, while services imports stood at $20.72 billion. The resulting surplus was approximately $19.79 billion.
The contribution of services to India’s total exports matters because this surplus offsets part of the deficit generated by merchandise trade.
A services surplus means the country earns more from selling services overseas than it spends on buying services from abroad. In October, that positive balance substantially reduced the combined trade gap.
Why the Overall Deficit Narrowed
The increase in India’s total exports exceeded the increase in total imports compared with October 2025. The published overall deficit consequently fell by about $5.06 billion, or roughly 20%, from its year-earlier level.
The goods-only deficit stood at $39.88 billion. Using the ministry’s published merchandise figures, that was lower than the $42.58 billion gap in October 2025.
However, the goods deficit widened compared with September 2026, when it was $30.21 billion. The annual improvement and monthly deterioration therefore describe different comparisons.
Higher import spending contributed to the monthly pressure. Gold imports rose to $5.51 billion from $1.8 billion in September, while petroleum imports were $22.82 billion, up about 54.3% year-on-year.
These figures explain why record export earnings can coexist with a substantial merchandise trade deficit.
Export Growth Reaches More Overseas Markets
The rise in India’s total exports was accompanied by wider growth in merchandise shipments across international markets.
The Federation of Indian Export Organisations, or FIEO, said goods exports increased across 43 of India’s top 50 export destinations in October.
According to the organisation, exports to the United States grew approximately 39%, shipments to China increased 48%, and exports to Japan rose 45%. The United Kingdom, Taiwan and Kenya each recorded growth of more than 50%.
FIEO president S. C. Ralhan highlighted the spread of growth across markets and called for stronger buyer relationships, competitive products and better use of preferential access under trade agreements.
April–October Exports Reach $568.84 Billion
Across the first seven months of the financial year, India’s total exports were estimated at $568.84 billion, up 16.66% from $487.59 billion in April–October 2025–26.
Combined imports increased 16% to $662.19 billion during April–October 2026–27.
The overall deficit for that seven-month period widened to $93.35 billion, compared with $83.25 billion a year earlier. Although exports grew faster in percentage terms, imports increased from a larger starting value.
October’s narrower annual deficit therefore sits within a financial-year picture that still shows a larger cumulative trade gap.
What Will Determine Whether Growth Continues?
Assessing India’s total exports requires looking at shipment volumes, prices and the timing of orders.
ICRA chief economist Aditi Nayar said the October merchandise growth rate was amplified by a lower comparison base linked to the shift in the festive calendar, alongside commodity price inflation.
This matters because export figures measure dollar earnings. Higher prices can raise the value of shipments without an equivalent increase in the physical quantity exported.
For India’s total exports to sustain their momentum, exporters will need to convert stronger market access into repeat orders while managing financing, production and delivery costs. FIEO identified affordable credit, lower transaction costs and efficient logistics as priorities, particularly for smaller exporters.
The next monthly releases will show how much of October’s strength carries forward across products and markets, and whether export earnings can continue to keep pace with the import bill.
For more insights navigate: PressPire | Stories That Shape the Future
Read previous article here : indian-ai-startups-indiaai-second-cohort/
Follow PressPire on Facebook | Instagram | LinkedIn | YouTube
PressPire | Stories That Shape the Future